Anomaly Detection
As noted in Optimization Under Uncertainty, some inputs to a simulation model may not be fully known or controlled. The values of these parameters are typically estimated or tuned to ensure the simulation model is accurate. However, any uncertainty in model parameters will cause uncertainty in the model’s output. In Optimization Under Uncertainty, we used confidence bounds to establish system performance predictions under uncertainty. Given some confidence level, we can establish the range of expected system output. Anomaly detection is a natural extension of this analysis. It determines when the system’s behavior falls outside the expectation, that is, when the simulation model fails to predict the observed behavior. Detecting anomalous events is vital for autonomous systems or any tightly controlled system since accurate predictions are necessary for model-based actions and decisions. Furthermore, an anomalous event can be caused by a system failure, fault, or mode change. Therefore, anomaly detection may be the first step in uncovering a more significant issue with the system.
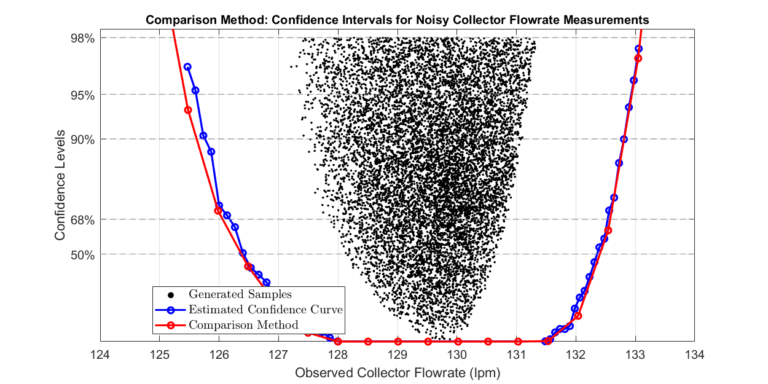
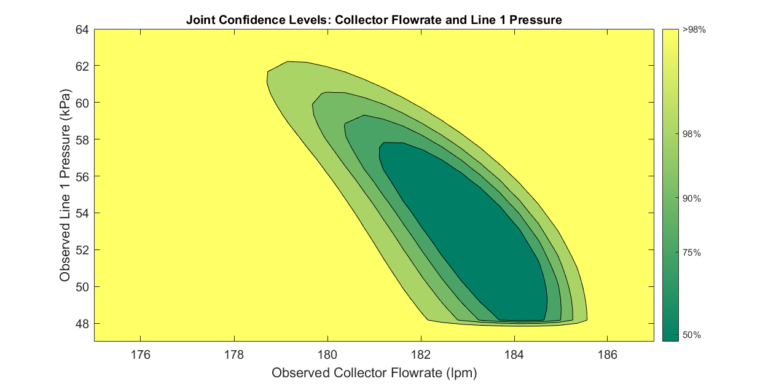
Understanding the concept of confidence levels is key to implementing anomaly detection. In the previous section, we presented a plot that displays the computed confidence levels of a system’s output. These levels help us establish the expected value of the system’s output. Any values that fall outside of this range would be considered anomalous, indicating a deviation from the system’s expected behavior.
Known and Uncertain Variables
In Surrogate Model-Based Optimization, we established the difference between decision and fixed variables. Here, we introduced a similar classification of model inputs: known and uncertain variables. Known variables are inputs to the model that are assumed to be perfectly known—for example, control parameters such as motor speeds or actuator voltages. Uncertain variables are inputs to the model that need to be estimated or are not completely known. Therefore, we cannot establish the exact values of these variables. However, as seen in Optimization Under Uncertainty, we can compute ranges of their possible values. As discussed in Surrogate Model-Based Optimization, the union of \( x_{\text{known}} \) and \( x_{\text{uncertain}} \) must equal the complete input set of the model. Therefore, an input to the model is either known or uncertain. In the context of surrogate models: \( \text{surrogate}(x) = \text{surrogate}(x_{\text{known}},x_{\text{uncertain}}) \)
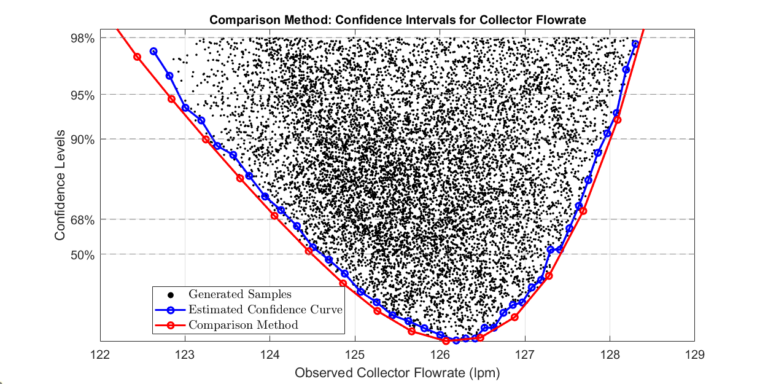
Note that the surrogate model’s output will be uncertain since the uncertain variables, \( x_{\text{uncertain}} \), can take a range of values. The following sections will present two approaches to computing confidence levels for the surrogate’s output.
Sampling Approach
The sampling approach utilizes the parameter estimation confidence levels from Parameter Estimation via Profile Likelihoods. We start by estimating the parameter via profile likelihood, enabling us to compute the confidence levels of various parameter configurations. Similar to Optimization Under Uncertainty, we consider the set of all possible uncertain variable values for a given confidence level \( \alpha \), \(P_\alpha = \{ x_\text{uncertain}^1,x_\text{uncertain}^2,\dots.\}. \)
We will approximate the infinite set \(P_\alpha \) with a finite set \(\bar{P}_\alpha \) ,
\( \bar{P}_\alpha = \{ x_\text{uncertain}^1,x_\text{uncertain}^2,\dots x_\text{uncertain}^n\}. \)
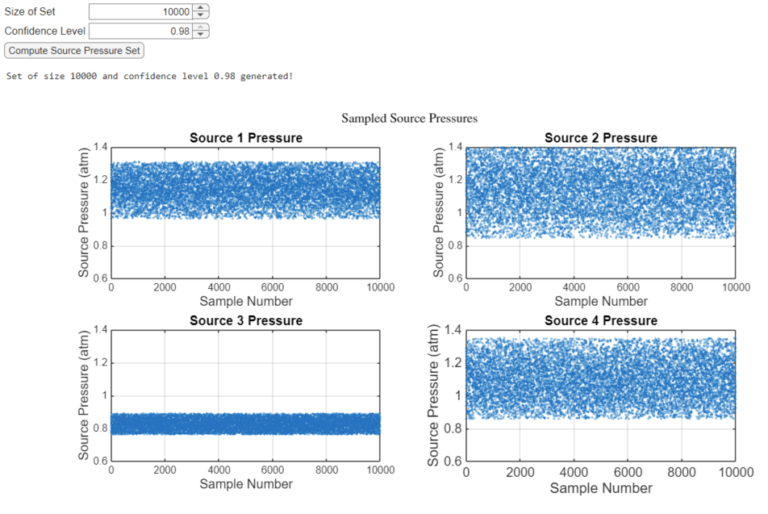
The finite set \( \bar{P}_\alpha \) is constructed by iteratively computing the likelihoods of randomly generated sets of fixed variables. Any \( x_\text{uncertain}^i \) that achieves a minimal likelihood (based on the selected confidence level \( \alpha \) and the number of uncertain variables [1]) is placed into the set \( \bar{P}_\alpha \). The process is repeated in a loop until \( \bar{P}_\alpha \) is of the desired size. The likelihoods of \( x_\text{uncertain}^i \) are also recorded in \( \bar{S}_\alpha \).
Next, a set of inputs to the surrogate model can be created by augmenting the members of \( \bar{P}_\alpha \) with a known input, \( x_{\text{known}} \):
\( X = \{ (x_\text{known}, x_\text{uncertain}^1),(x_\text{known}, x_\text{uncertain}^2),\dots (x_\text{known}, x_\text{uncertain}^n)\} \).
All members of \( \bar{P}_\alpha \) are augmented with the same \( x_{\text{known}} \) since confidence bounds are computed at a specific operating point. The surrogate model is evaluated over all \( X \):
\( \text{surrogate}(X) = Y = \{y_1,y_2,\dots,y_n\} \).
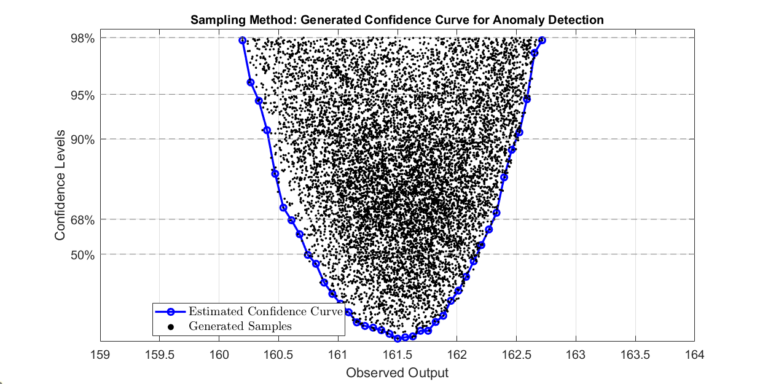
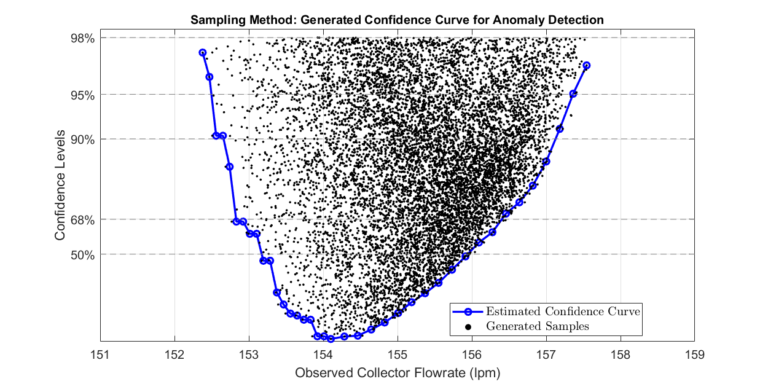
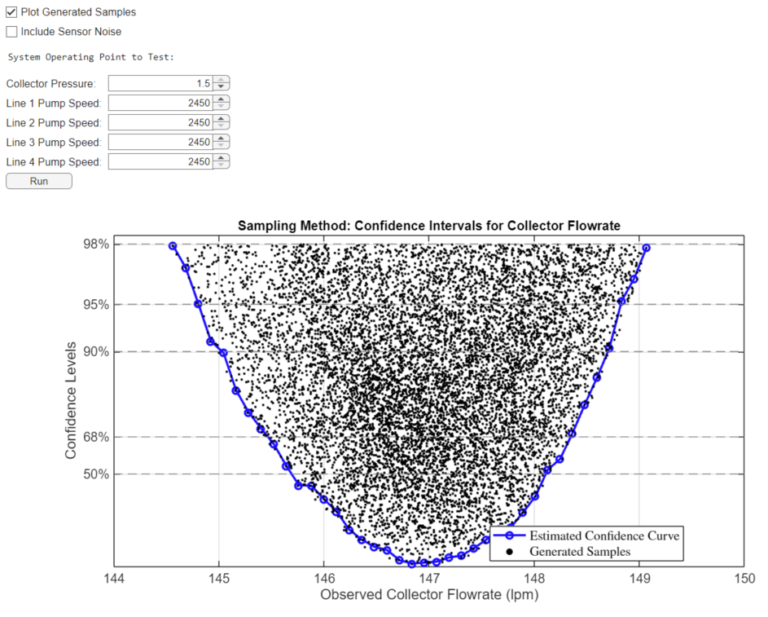
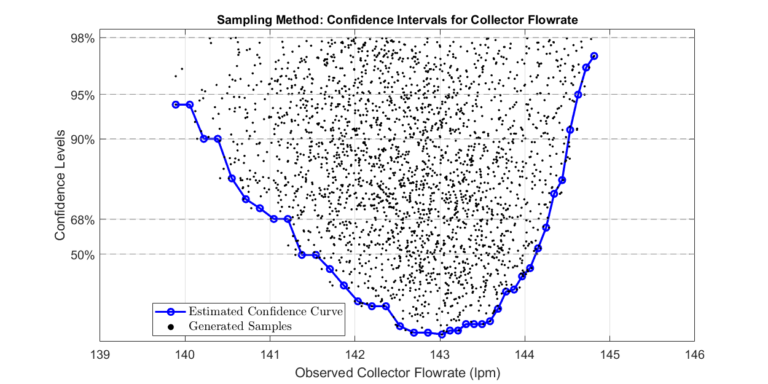
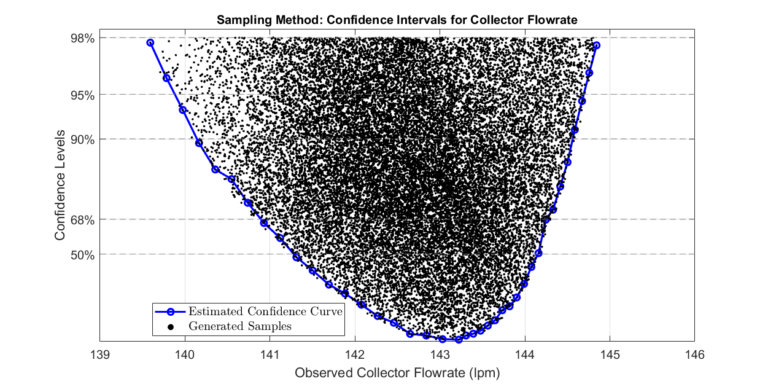
The sets \( Y\) and \( \bar{S}_\alpha \), likelihoods computed during the creation of \( \bar{P}_\alpha \), are used to calculate confidence levels of the surrogate model output. The plot below visualizes the approach. Note that the accuracy of the estimate confidence curve will increase with more samples. If the system’s operating point changes, we repeat the process to compute confidence levels at the new operating point.